On this page
Regional pricing mistakes are invisible money eaters. They don't send alerts or show up in your error logs. They just sit there, quietly bleeding revenue until something finally makes you look: frustrated players on social media, gray market resellers eating your sales, or a country that moves tons of units but barely registers on your revenue line.
The good news: spotting these problems takes about 5 minutes once you know where to look.
 (enlarge)
The two red flags you need to spot
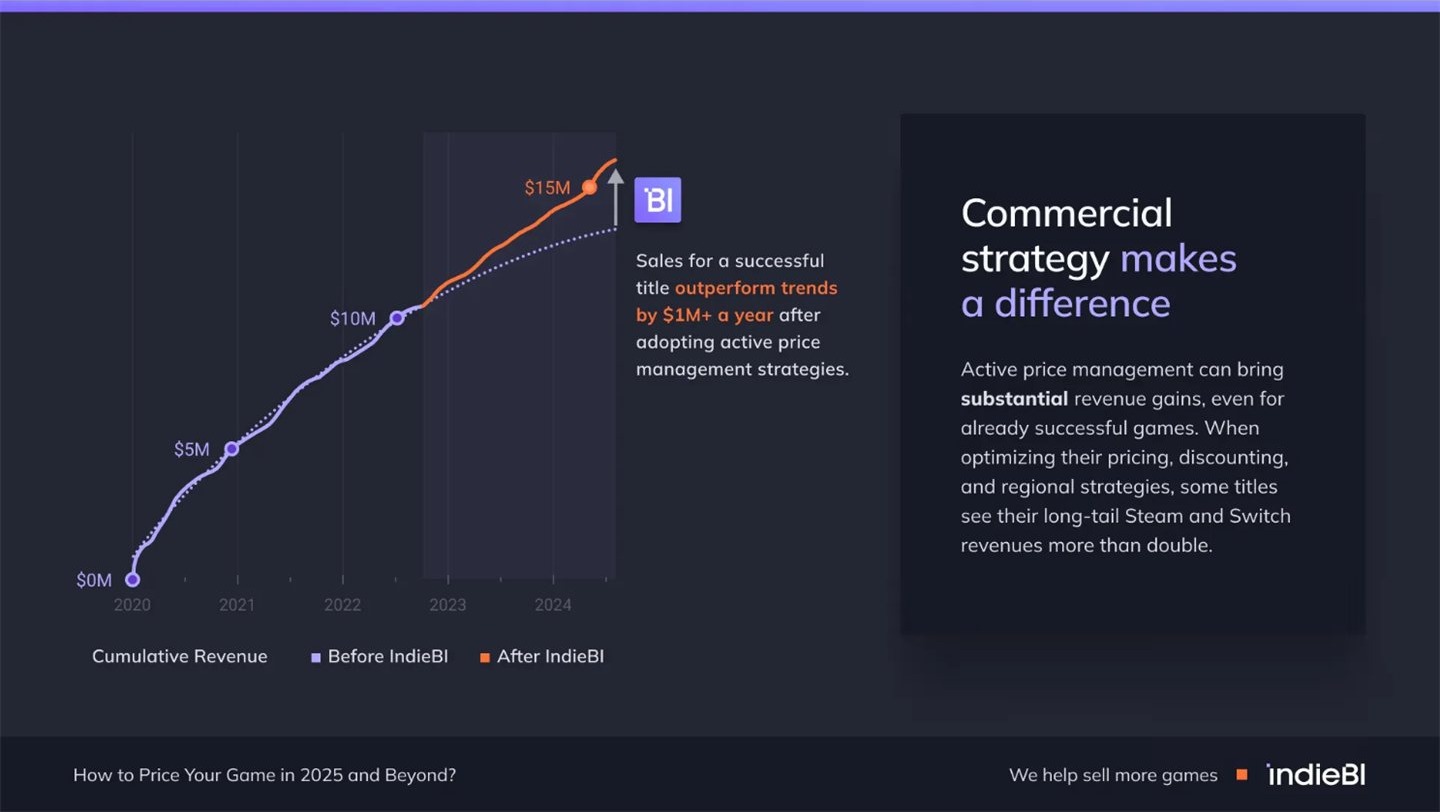
Pricing matters more than most studios give it credit for. A great game with bad pricing can still underperform; a decent game with smart pricing punches above its weight. There's a lot that goes into getting it right: our CEO Tom breaks down the full picture in this article. We've run in-depth pricing analyses using real revenue data (not estimates), and these same issues keep surfacing. Both are easy to check in IndieBI.
Red flag #1: prices higher than the US in lower-income countries
If Poland or Brazil costs more than the US, something is wrong.
Many game prices are still based on outdated Steam regional pricing recommendations from 2022, set during the currency turmoil. Those numbers are years out of date now, and your players know it.
In Poland, there's an active movement called #PolishOurPrices where players organize against games they feel are unfairly priced. They share lists, leave negative reviews, and push for refunds. You don't want to end up on their radar.
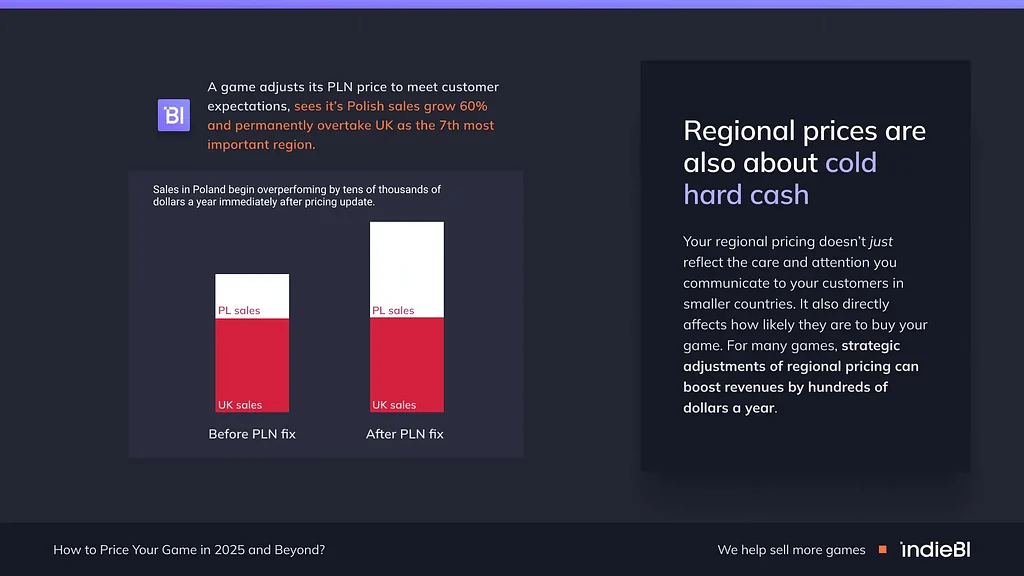
What you'd prefer to get is a nice bump in sales and players' respect, just as in the example below.
 (enlarge)
The rule: lower purchasing power countries should have lower prices than the US, not higher.
Red flag #2: prices that are way too low
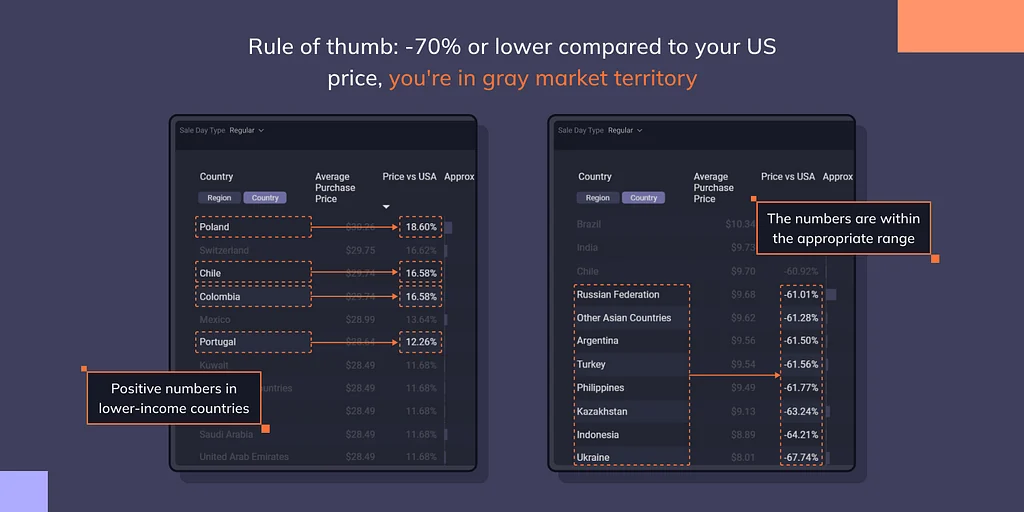
If any country shows -70% or lower compared to your US price, you're in gray market territory.
Argentina and Turkey are the classic examples. Their currencies collapsed so hard that older pricing configurations became dangerous. A game you priced at $20 in Argentina years ago might now cost the equivalent of $0.60 in local currency: not because you intended a 97% discount, but because inflation and devaluation did the math for you. At those prices, resellers buy keys in bulk and distribute them globally. You get the sale, technically, but it's a fraction of what you'd earn from a legitimate purchase in Europe or the US, and it cannibalizes sales you would have made at full price.
The worst part: there's no fraud to report. The purchases are real. The keys are valid. You just set the price too low for the current reality.
The rule: anything below -70% vs the US is a signal to investigate. Below -90% is a fire alarm.
How to check your pricing in 5 minutes in IndieBI
Step 1: Open the Country Data dashboard
Go to your Country Data dashboard and scroll down to the table at the bottom. This shows detailed metrics per country, including average purchase price.
 (enlarge)
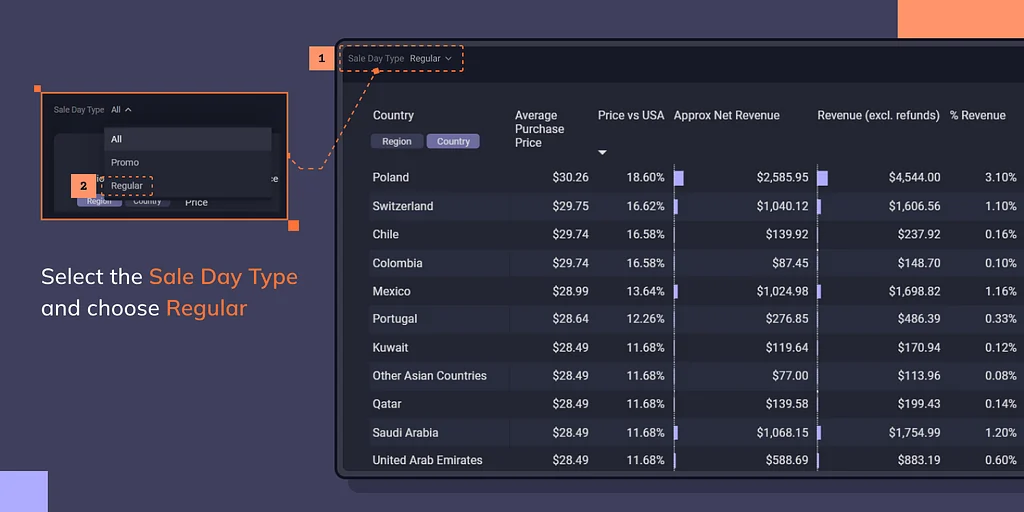
Step 2: Filter for regular prices only
The default view includes promos, which distorts the picture. Use the "Sale Day Type" selector and choose "Regular" to see your actual base pricing compared across regions. Remember also to filter the results to a single platform (for example Steam, PlayStation, Nintendo or Xbox).
 (enlarge)
Step 3: Look at the price difference vs the US
Scan the column showing the price difference relative to the US. You're looking for:
- Positive numbers in lower-income countries. Poland +18.6%? That's backwards.
- Extremely negative numbers anywhere. -90%? Someone's reselling your game.
 (enlarge)
Bonus insight while you're in Country Data: check the promo share per country column. You'll see how susceptible each nation is to discounts. Some countries buy almost exclusively on sale. Others barely shift. It's one of those data points that changes how you think about your discount strategy by region. IndieBI has a huge number of such insights for those ready to dive in and play.
Step 4: Check the Average Purchase Price chart
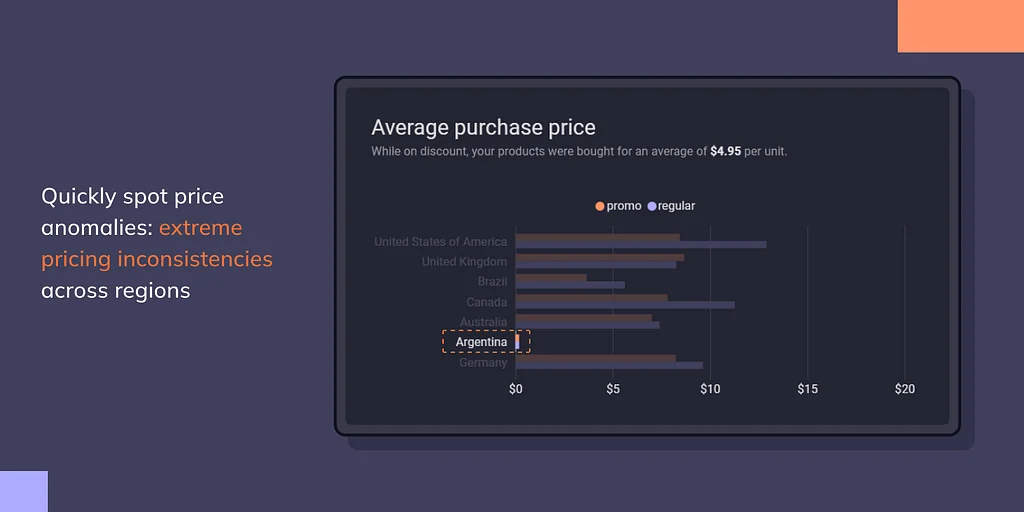
The "Average Purchase Price" chart in Details by Country makes problems even easier to spot visually. Look for outliers.
Example of a problem: Argentina showing a $0.19 average purchase price when the US and Europe are at $7 or more. That's a 97% discount effectively built into your pricing structure.
 (enlarge)
Step 5: Check unit distribution vs revenue
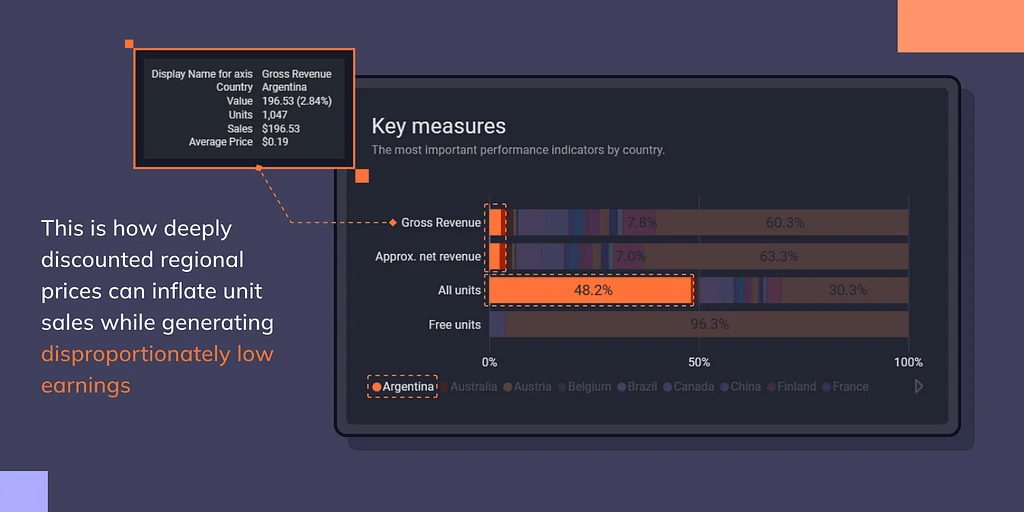
Open the "Key Measures" bar chart in Details by Country. Compare where your units are sold vs where your revenue comes from.
- Healthy: the USA or China as your biggest markets by units.
- Problem: a lower-income country dominates unit sales but barely registers in revenue.
Real example: one game sold 48.2% of its units in Argentina, 1.5x more than in the US. But Argentina generated only 2.8% of its gross revenue. That's the math of bad regional pricing in action.
 (enlarge)
Want to check your own portfolio? All the dashboards in this article are part of IndieBI. Connect your stores and the data shows up automatically.
What if you find problems?
Once you spot an issue, you'll need to update your prices on each platform. Steam lets you adjust regional pricing directly. Console platforms have their own processes.
For a deeper dive into how to think about pricing strategically, check out our article where Tom, our CEO, shares what we've learned from tracking 100K+ SKUs across the industry.
If you're managing multiple titles across multiple platforms, this becomes a recurring maintenance task: exactly the kind of thing that slips until you see angry tweets or revenue that doesn't match your unit sales.
Don't want to deal with this yourself? IndieBI's Regional Pricing service handles regional pricing corrections for you, and makes sure you don't miss sale opportunities across platforms. If you want someone else to run these checks and act on them, let's talk.
 Tom Kaczmarczyk