
This article explains how we calculate the baseline in IndieBI dashboards.
 (enlarge)
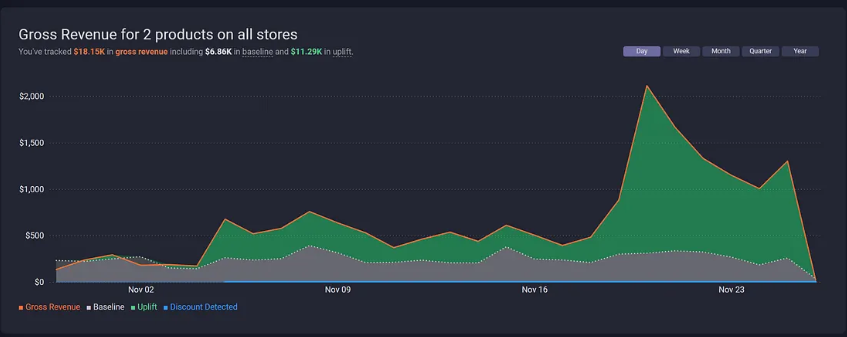
The baseline represents an estimated level of “natural” sales performance, serving as a reference point for identifying deviations caused by external factors such as promotions, discounts, or major events. It is not a prediction or forecast, but rather a neutral benchmark that helps highlight when and where performance diverges from typical patterns.
This allows teams to better understand the impact of specific actions or market conditions by comparing actual sales against this baseline. It is calculated from the existing sales data ( free_units, units_returned, units_sold_directly, units_sold_non_billable, units_sold_retail, gross_returned, gross_sales, net_sales_approx).
Baseline calculation criteria
To ensure meaningful baseline calculations, SKUs with total gross sales below $1,000 are excluded due to insufficient data. However, to accommodate free SKUs that generate revenue through in-app purchases, this filter is not applied if the SKU has no paid units sold and has distributed over 1,000 free units.
In addition, if a product has no recorded transactions on more than half of the days within the selected date range for a specific product, platform, and country combination, the baseline will not be calculated.
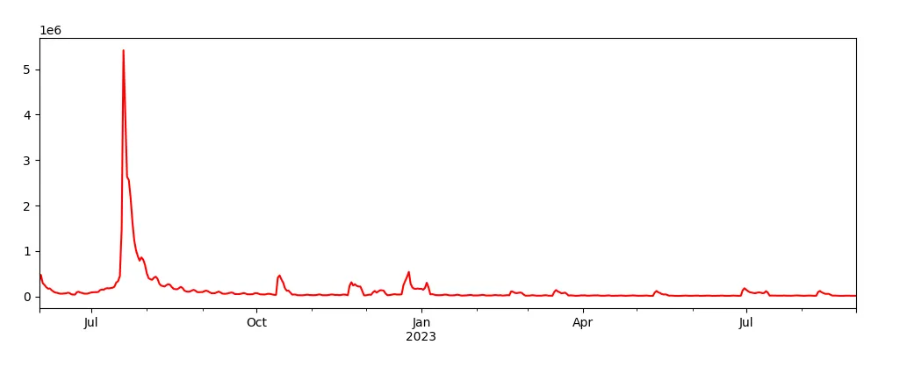
Here is an example of a time series for a specific product:
 (enlarge)
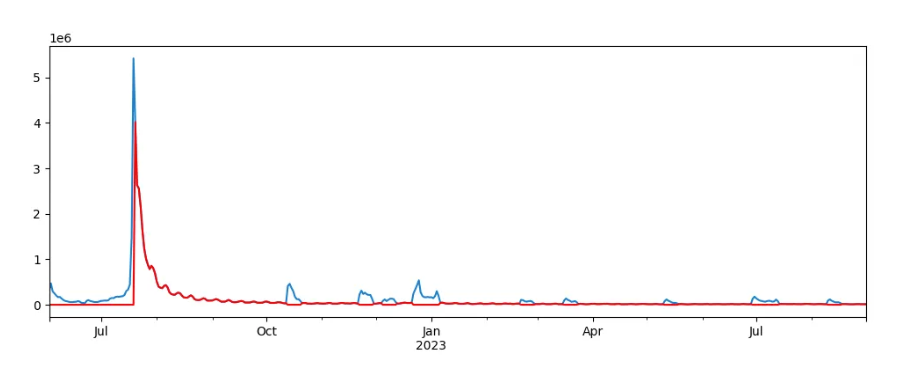
The first step in the baseline calculation is removing all the promo days. Additionally, days immediately adjacent to promotions are also trimmed, as they can be distorted by pre-promotion anticipation or post-promotion hangover effects.
 (enlarge)
Data smoothing and outlier handling
To reduce launch-related noise, all values are set to null for the first 30 days after the first recorded sale. In some cases, like the example shown, early peaks may remain if the pre-sale period is longer than 30 days.
At this stage, data is aggregated at the product_id level to simplify processing.
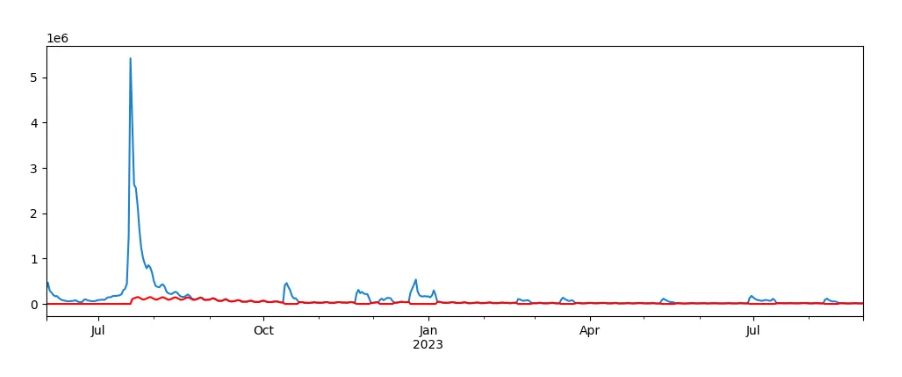
To handle anomalies, we calculate the 5th and 95th percentiles by product_id, country_code, and weekday to account for seasonality. Values outside this range are clamped to the nearest boundary. Unusually large sales spikes are also trimmed to prevent them from distorting the baseline, particularly for titles with limited sales history.
 (enlarge)
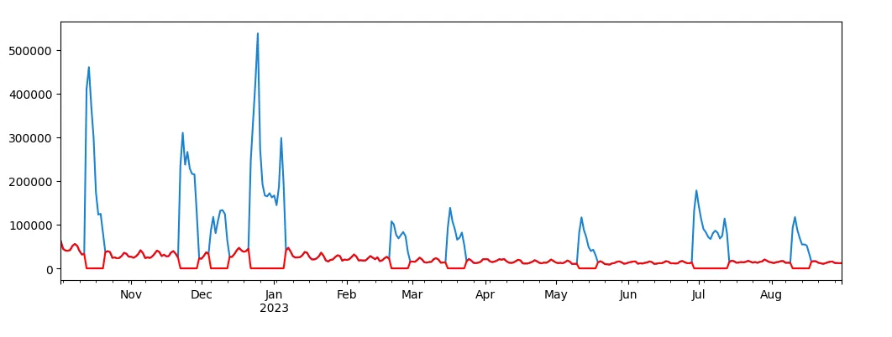
If we change the scale it looks like this.
 (enlarge)
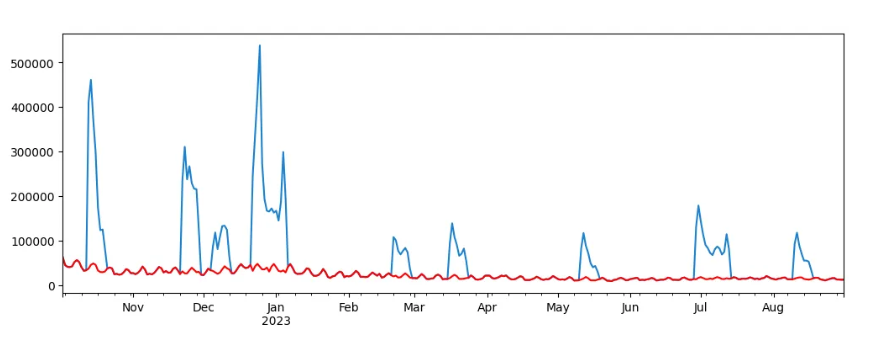
Next, the gaps in promo periods are filled with linearly interpolated values (over product_id, country_code, and weekday).
 (enlarge)
Filling remaining gaps in the baseline
Gap-filling is only performed when there is sufficient data for the same product × country × weekday combination. This ensures that interpolated values are based on meaningful patterns rather than sparse or noisy data.
When insufficient data exists for a given combination, the missing baseline defaults toward zero rather than relying on broader fallbacks. This produces a more cautious baseline that avoids overstating expected performance for titles with limited history.
When we have enough data, we apply several fallback strategies:
- Group medians with weekday: when the beginning or end of a time series lacks data for interpolation, or the data is sparse with large gaps.
- Forward/backward fill: when a group has only 12 values, which makes a median unreliable, when a product or country was added recently with little history, or when there are sequential nulls at the edges.
- Product-country medians (no weekday): when a product has never sold on certain weekdays, when weekday-level data is too sparse, or when there are holiday effects or strong seasonality.
- Global medians: when a product-country combination is brand new, when the data comes from test markets or pilot programs, or when data collection issues leave groups empty.
The final step is applying a rolling median to smooth the entire baseline and reduce short-term fluctuations.
Conclusion
These steps are designed to give you a reliable, consistent view of your product’s natural sales performance across platforms and markets. By carefully filtering, smoothing, and filling gaps in the data, IndieBI’s baseline helps you isolate the true impact of your actions, whether it’s a discount, a feature, or a major update. We hope this gives you more confidence in your decisions and a clearer picture of what’s really driving your results.

 Aleksander Grzelka

 Tom Kaczmarczyk